Home ·
Search ·
About ING ·
Astronomy ·
Public Information ·
Engineering
ISIS Red Arm
-
General
information on the device
- Spectral resolutions and wavelength coverage
- Spatial scale on ISIS
- Fringing and Cosmetic defects
- Flux standard data and empirical through-puts
- Quality control history
Back to ISIS Homepage
Spectral resolutions and wavelength coverage
The table below gives the dispersion provided by each grating when mounted
blaze to collimator (see the ISIS
manual for more in depth details on gratings and their properties),
and the spectral range covered by the TEK4 CCD. There is no vignetting
when using a TEK chip on either spectrograph arm (as it is 24.6 mm).
wavelength coverage and resolutions with TEK2 |
Grating |
Blaze |
Dispersion
(Å/mm) |
Wavelength bin per pixel
(Å) |
Total Spectral range
(Å) |
Slit-width for 50 mu at detector
(in arcsecs) |
R158R |
6500 |
121 |
2.90 |
2970 |
0.8 |
R316R |
6500 |
62 |
1.49 |
1525 |
0.8 |
R600R |
7000 |
33 |
0.79 |
809 |
0.9 |
R1200R |
7200 |
17 |
0.41 |
420 |
1.15 |
Spatial scale on ISIS
The blue (and red) camera is a folded Schmidt design of 500mm and gives
a scale of 14.9 arcsec/mm along the slit. Hence a spatial scale of 0.36
arcsec/pixel is achieved with the TEK4. The maximum unvignetted slit-length
usable with ISIS is 3.7 arcmin (corresponding to a ~650 detector pixels,
spanning [1:1024, 200:850]).
Fringing and Cosmetic defects
Fringing begins at about 7500Å on the TEK chips, and the ripples
are visible at about 2-3% level (peak-to-peak). This increases to ~10%
at 9000, rising to ~15-20% at 10000Å. Click here to see an illustrative
flat field spectra. Exact fringe measurements will soon be linked from
here.
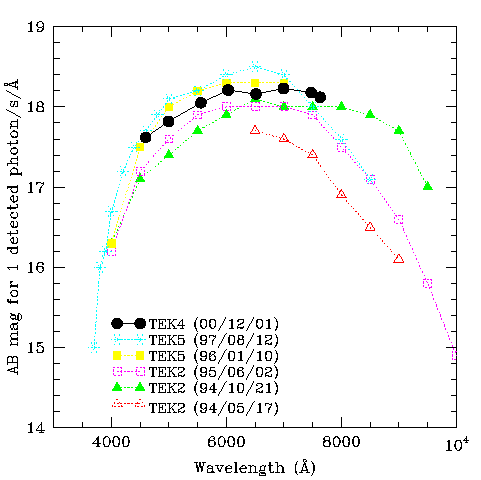
Flux standard data and empirical through-puts
The figure below shows the results from recent through-put measurements
of flux standards. The Y-axis is the apparent AB magnitude of star observed
at zenith which gives one detected photon per second per Angstrom. The lowest resolution grating was used (R158R) in the blue arm (without
a dichroic) with a wide slit of 8 arcsec, the conditions were photometric, with negligible dust levels present.
In order to judge the relative through-put in the red arm across a wide
wavelength range, this is the figure to follow rather than just the raw
QE curve of a CCD. This shows the response of the whole ISIS red channel
(i.e. WHT primary + secondary + ISIS red optics + detector response) from
~4500 to ~7650 Å.

Quality control history